
The Wave is essentially showing what the market’s shorter term direction is.
You can use it in your trading as an indication as whether you should enter a trade or wait ?. Or if you are too anxious to trade as an opportunity for a very short term trade.
After you have found what the Trend is you should check what the Wave is. If there are opposite then it means you should wait a bit before entering a trend following trend.
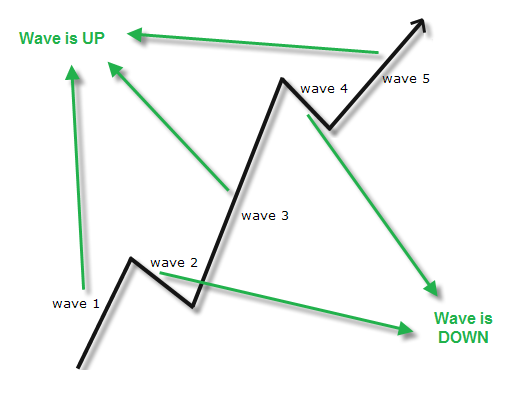
The picture shows a market following an UP trend comprised by 5 waves.
Waves 1,3,5 are following an UP direction. A trader should place a Long position (Buy) when the market wave is at this stage
Waves 2,4 are following an DOWN direction. A trader should wait for the Wave to change direction during this stage and then place a Long possition (Buy).
How to measure Wave
Wave Indicators (Signalling if Wave is Up/Down)
Wave indicators are constructed by comparing an indicator against its Moving Average Signal. As Moving Averages follow the Trend we are basically finding the Trend of an Indicator so this implies short term trend (Wave) .
1) Moving Average Convergence Divergence value (MACD) vs its Moving Average
2) Relative Strength Index (RSI) vs its Moving Average
3) Momentum vs its Moving Average
4) Stochastic vs its Moving Average
The usage is the same for all 4 indicators
Usage : If indicator is greater than its Moving Average Value Wave is UP
If indicator is lower than its Moving Average Value Wave is DOWN